svcTraceViewer - Debugging WCF Sevices
This is a quick post about Debugging WCF Services and using svcTraceViewer. I'm writing this because I spent over half an hour trying to figure out what was wrong with one of my WCF services and then another half hour trying to figure out where to find svcTraceViewer.
Once I figured out all of this the error happened to be really simple (the class I was trying to serialize was not marked with the DataContract attribute! If I were doing the same thing in ASP.NET or Quartz I would have seen the exception the first time and fixed it in the next second.
The error I was seeing in Fiddler and Chrome was:
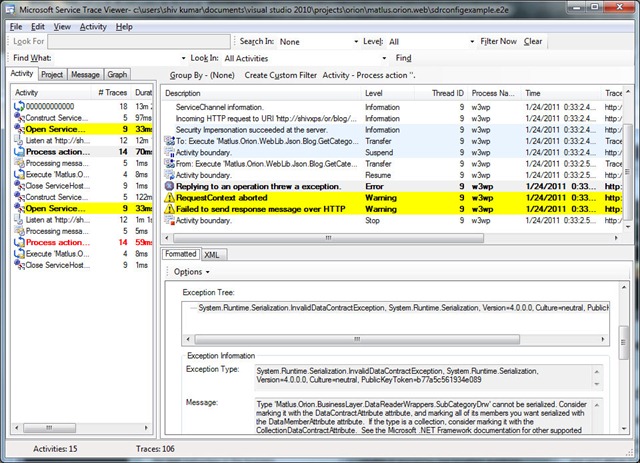
Replying to an operation threw a exception
Where is scvTraceViewer?
On my machine I found it in the following folders:
C:\Program Files (x86)\Microsoft SDKs\Windows\v7.0A\Bin\C:\Program Files (x86)\Microsoft SDKs\Windows\v7.0A\Bin\NETFX 4.0 ToolsC:\Program Files\Microsoft SDKs\Windows\v6.0A\Bin\x64C:\Program Files\Microsoft SDKs\Windows\v6.0A\Bin
The first one seemed to be the latest version so I used that.
Modifying Web.config for tracing
  <system.diagnostics>
    <trace autoflush="true" />
    <sources>
        <source name="System.ServiceModel" switchValue="Information, ActivityTracing, Error, Critical" propagateActivity="true">
          <listeners>
            <add name="sdt" type="System.Diagnostics.XmlWriterTraceListener" initializeData= "wcfTrace.svclog" />
          </listeners>
        </source>
    </sources>
  </system.diagnostics>
If you don't have a <system.diagnostics> section in your web.config file already, this section is a top level section, that is, it is a sibling of <system.web> or <system.webServer> or <appSettings> or a child of the root node <configuration>
Once you've set up your diagnostics section as shown above, exercise your service (and the method that's causing the problem) and you'll see the file wcfTrace.svclog created in the folder of your website application/website.
It so happens that files with the extension *.svclog are associated with svcTraceViewer! Of course I didn't know that when I first configured tracing and so I spent all that time trying to find scvTraceViewer. When I went to open the trace log file using svcTraceViewer and noticed that the default file extension it expects is .svclog I changed it.
Once you open the viewer you'll see log entries with errors highlighted in red (as shown in the image below), click on one of those entries and you'll see the cause for your error on the right hand side pane.
I hope this post helps others who have a similar problem. It's just not fun when you're trying to debug a problem and you can't figure out how to configure tracing and finding the tool that's going to get you out of the predicament.


